Project TimeLine helps managers to monitor the implementation of Releases/Epic in three dimensions:
How much work is done (percentage completion) - tracked as resolved vs unresolved issues
How much time is left (remaining days) - tracked as working days passed vs working days left
How much effort is spent (logged hours) - tracked as remaining estimate + logged hours vs original estimate (optional: can be switched off in Configuration)

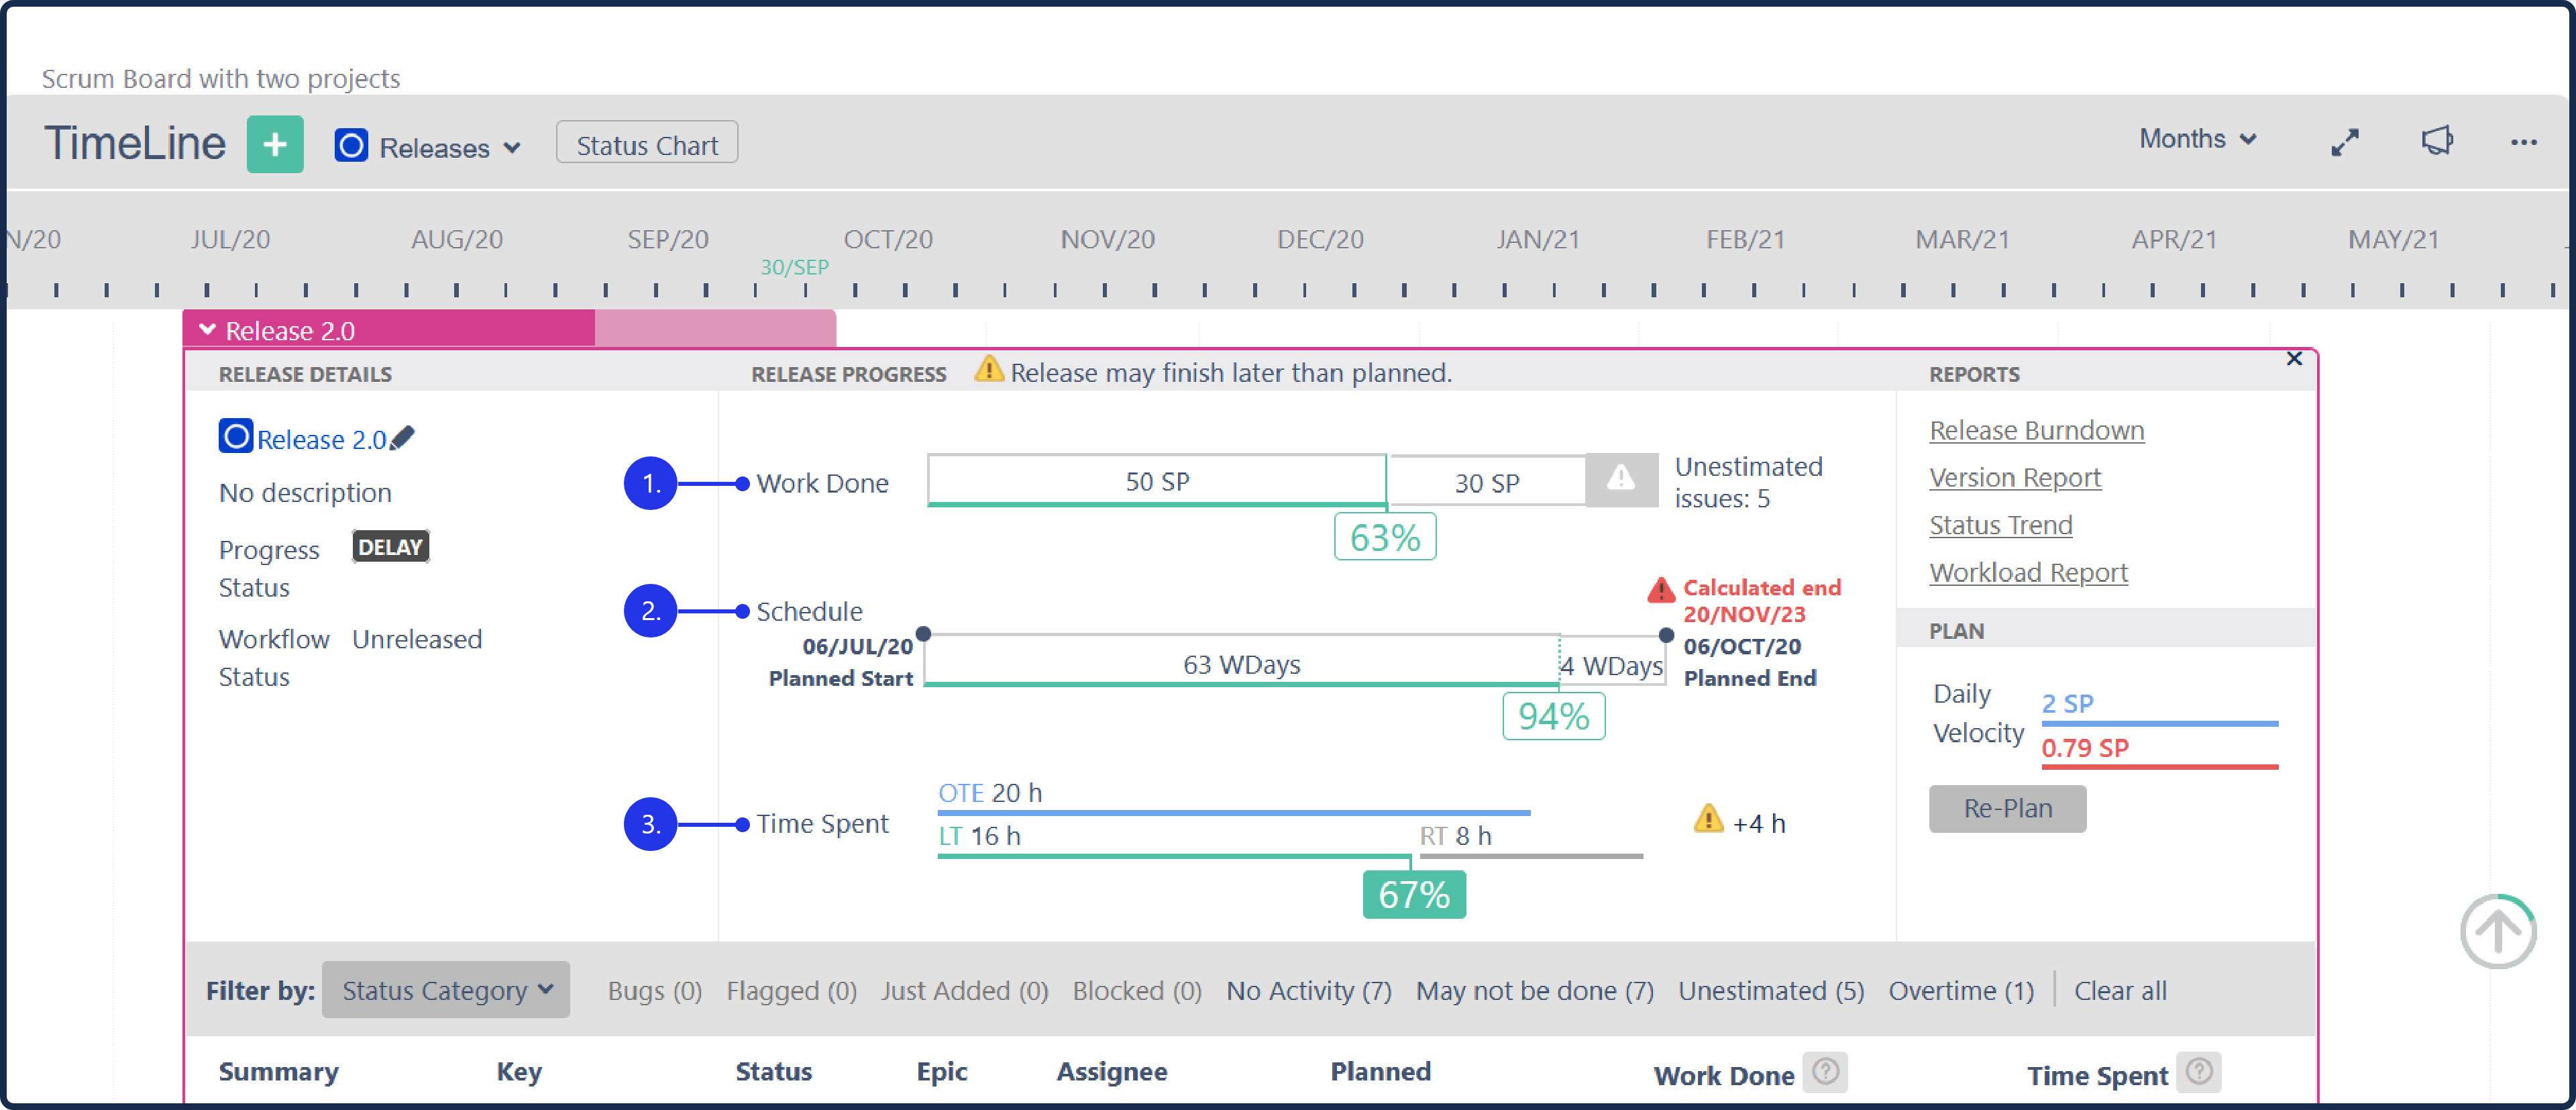
How to see percentage completion (Work Done)?
Navigate to the Release/Epic and expand it. The percentage completion is shown in “Work Done“ section as shown below:
Percentage Completion = Done / (Done + Remaining)
Done = Total estimates of resolved issues and sub-issues part of the Release/Epic
Remaining = Total estimates of unresolved issues and sub-issues part of the Release/Epic
Unestimated = Number of unresolved and unestimated issues and sub-issues part of the Release/Epic
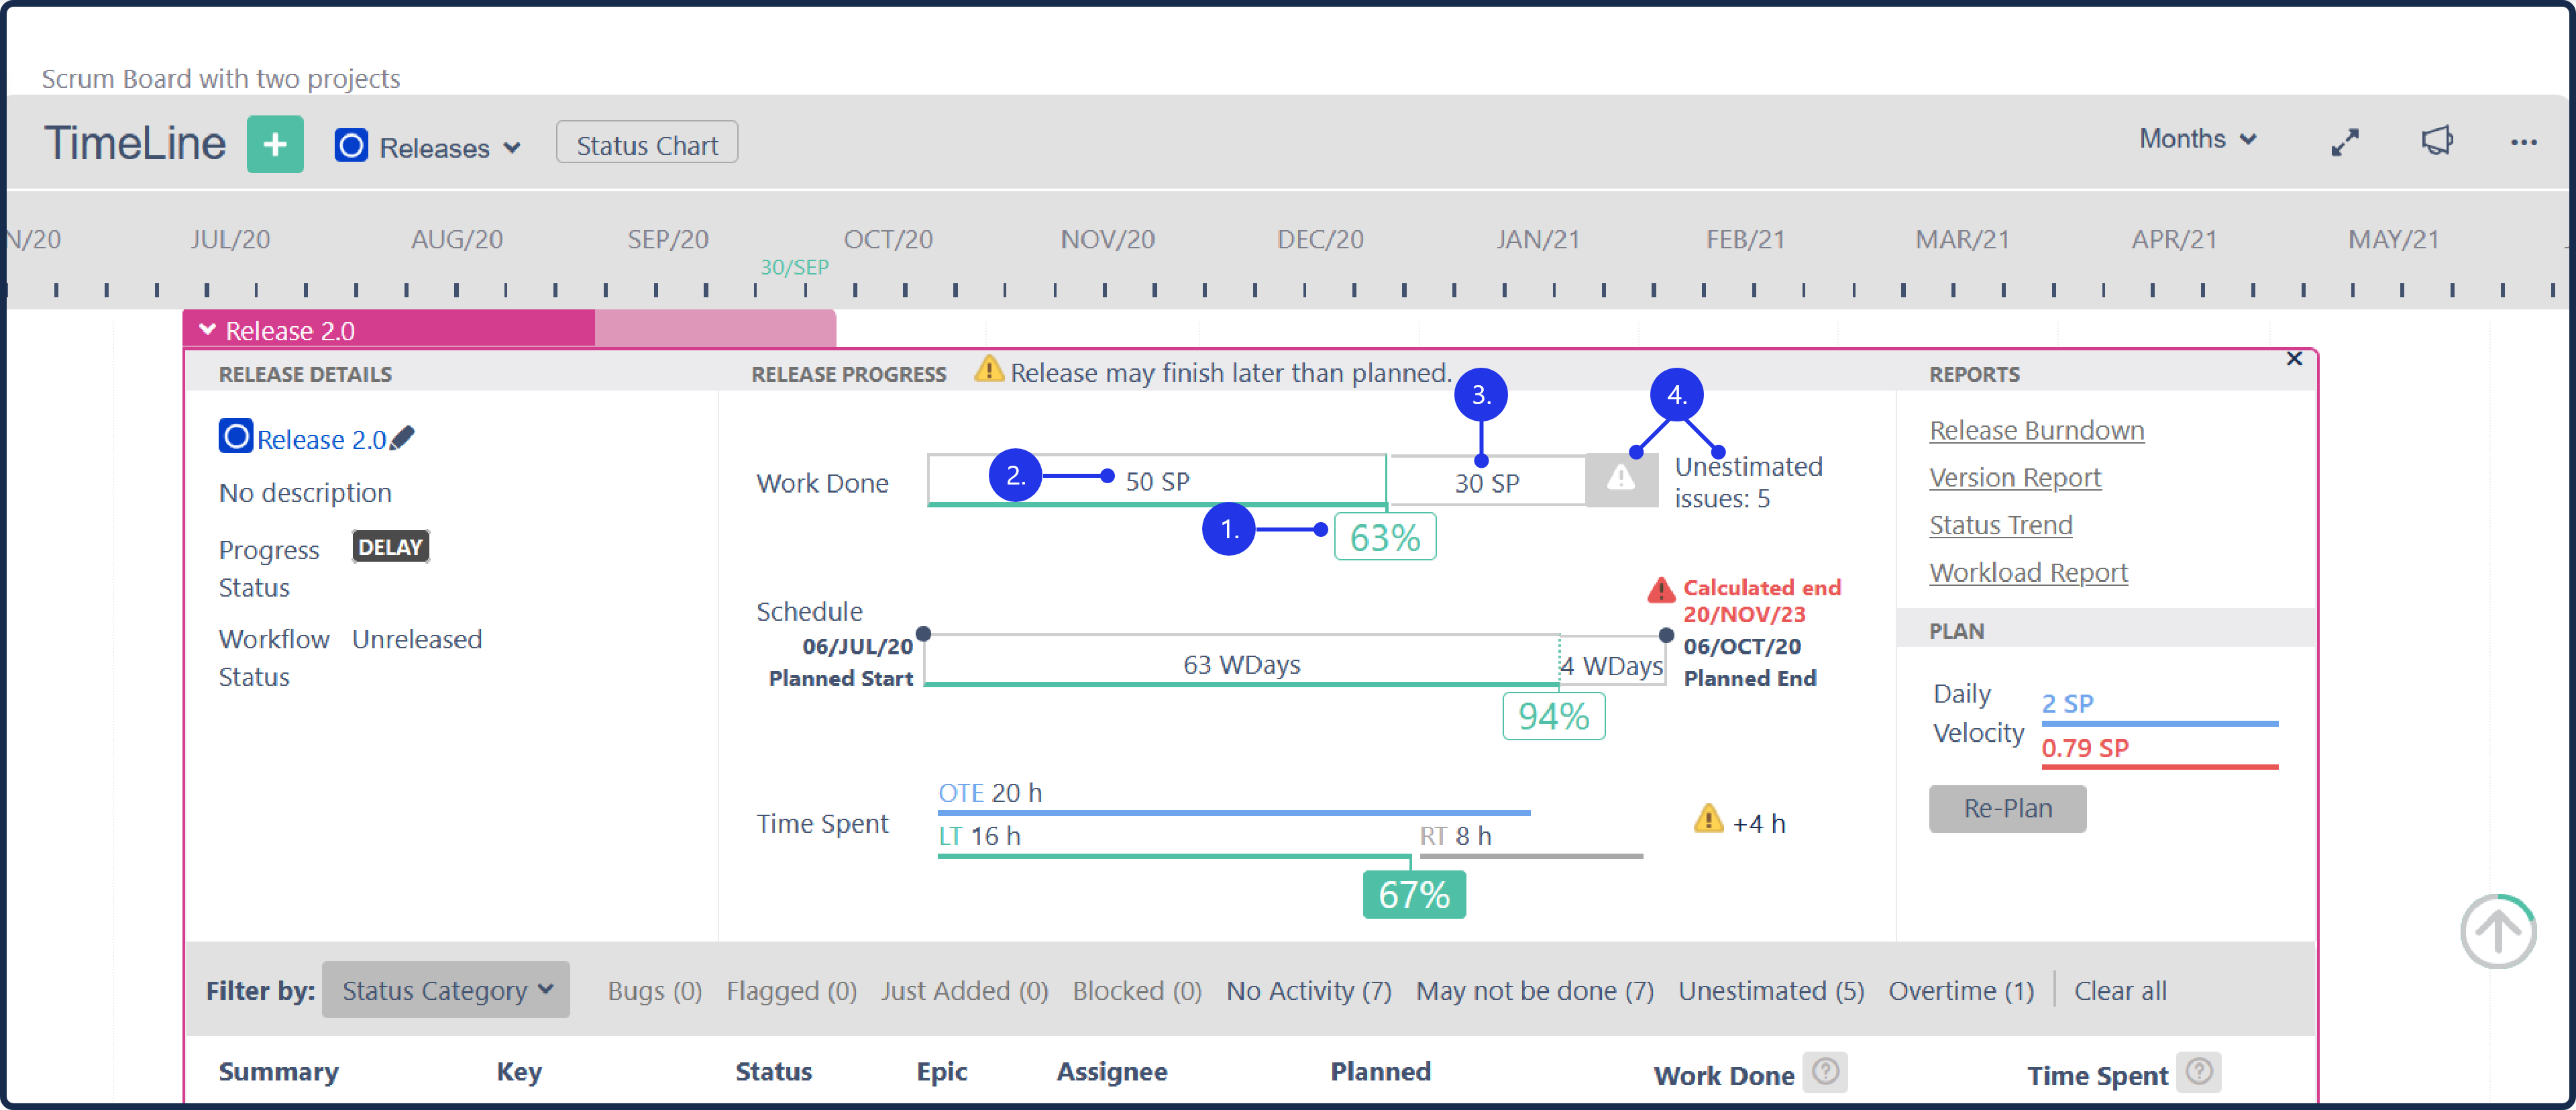

How to see remaining days until planned end?
Navigate to the Release/Epic and expand it. In the section “Schedule“ you can see:
Percentage of time elapsed = Days Passed / (Days Passed + Days Left)
Planned Start Date
Planned End Date

| Info |
|---|
Teams can configure public holidays and non-working days in Configuration. This will be taken into consideration when counting Days Passed/Days Left. |
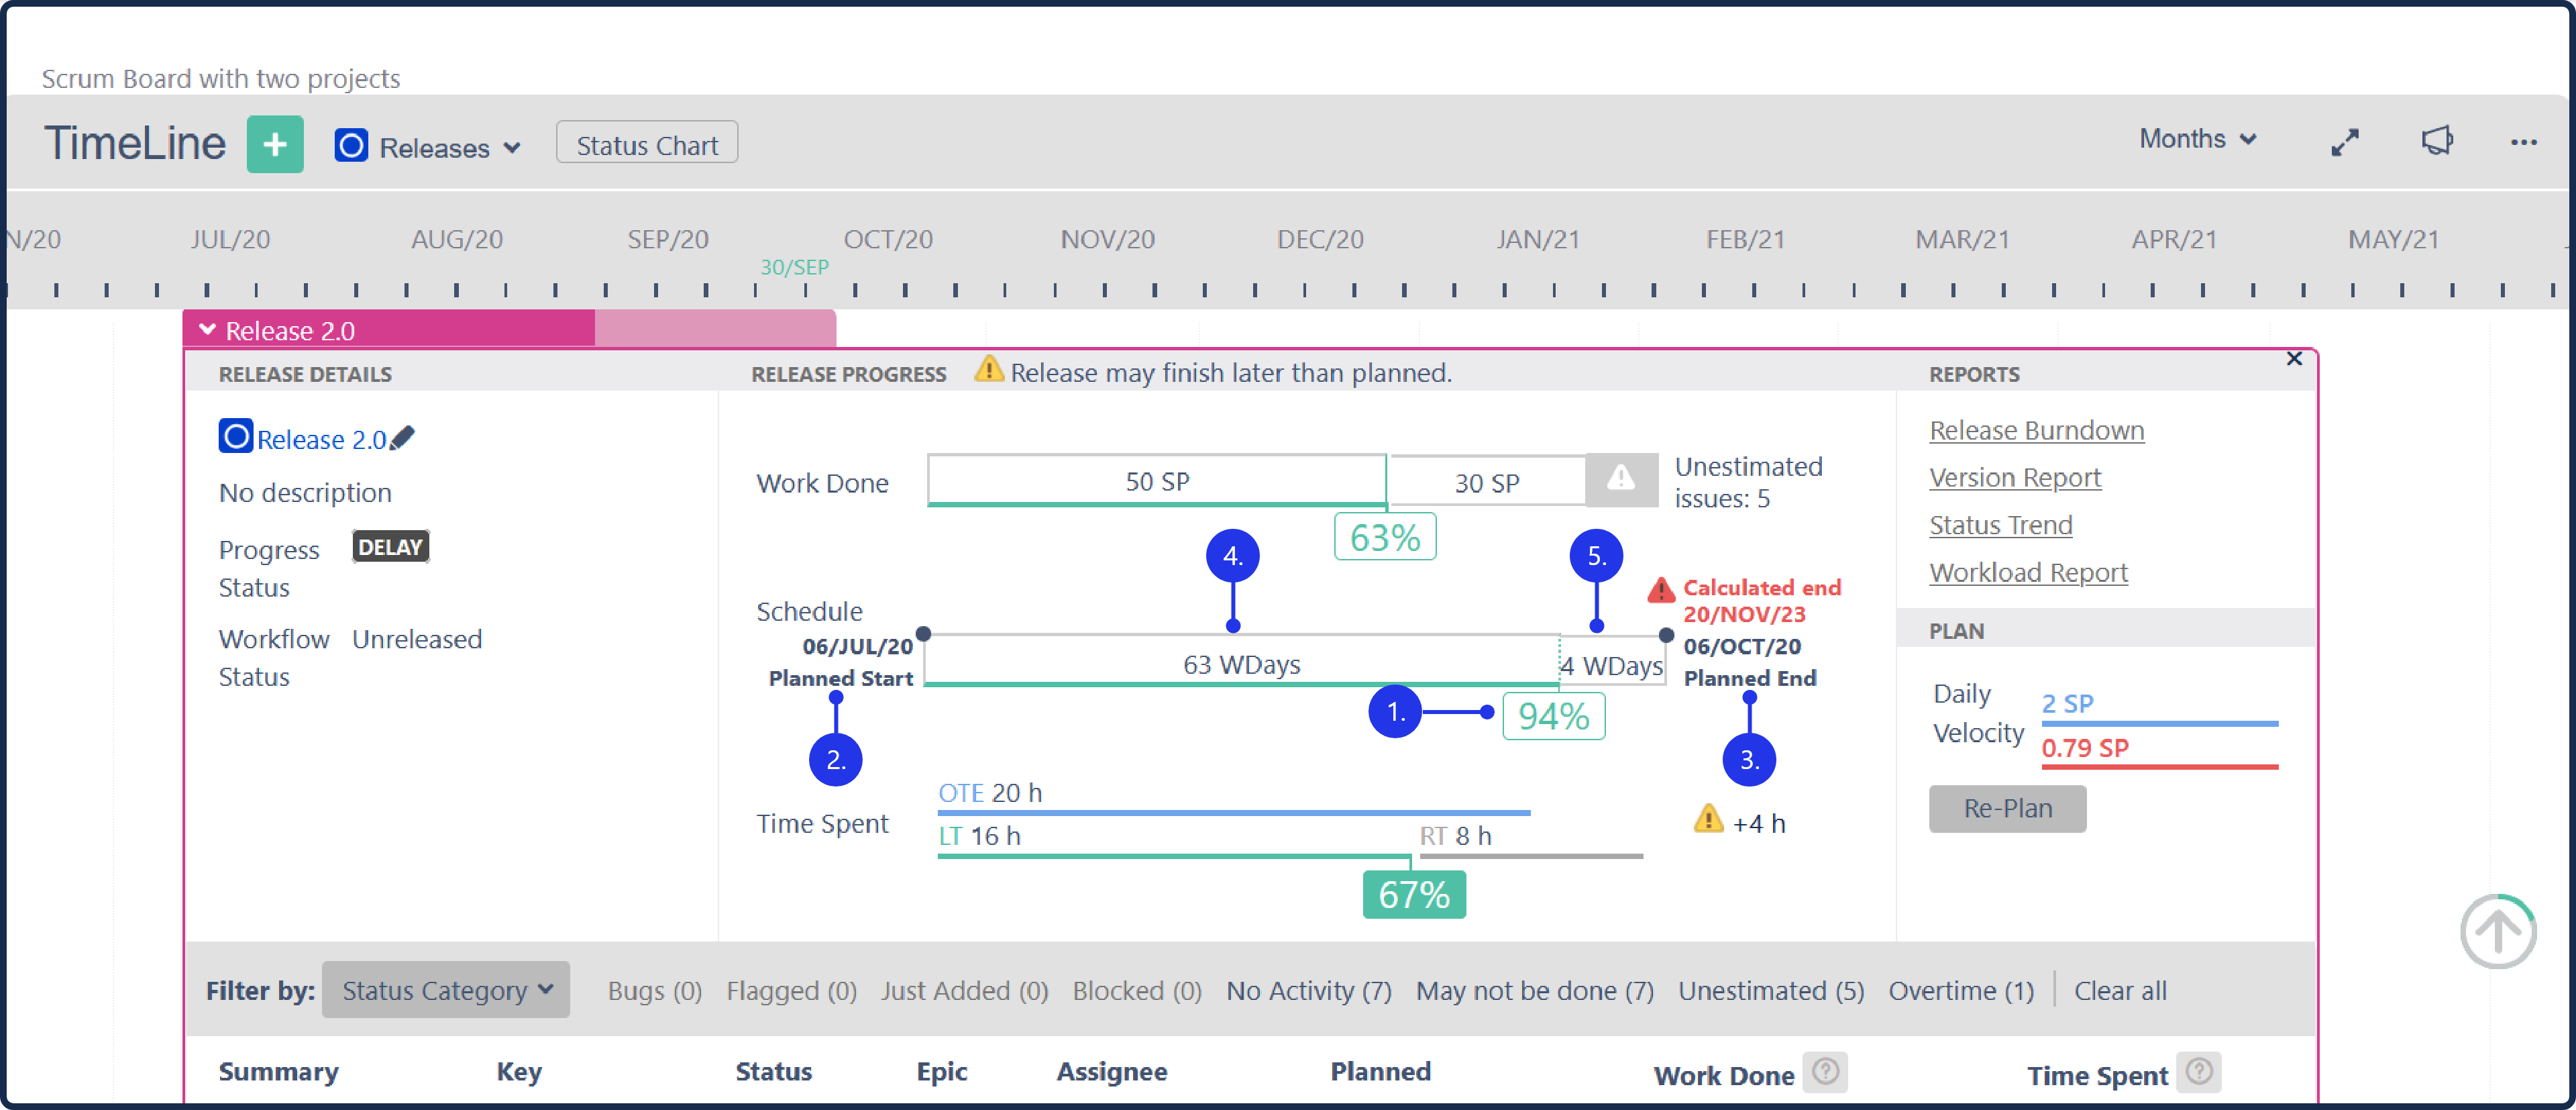
Based on the actual daily velocity, Project TimeLine calculates a predicted end date:
If the “Calculated end date” is before the “Planned End”, it will be presented in green. Hover over it and get details.
If the “Calculated end date” is after the “Planned End”, you will see a red warning. Hover over it and get details.
.png?version=1&modificationDate=1601474334598&cacheVersion=1&api=v2&width=673)
.png?version=1&modificationDate=1601472926012&cacheVersion=1&api=v2&width=673)
.png?version=1&modificationDate=1601474334598&cacheVersion=1&api=v2&width=680)
.png?version=1&modificationDate=1601472926012&cacheVersion=1&api=v2&width=680)
How to see logged hours?
Navigate to the Release/Epic and expand it. In the section “Time Spent“ you can see:
Percentage of work done according to the effort estimate = LT / (LT + RT)
LT (Logged Time) = total logged hours of all issues and sub-issues in the Release/Epic/Sprint
RT (Remaining Time) = total remaining hours (RTE) of all issues and sub-issues in the Release/Epic/Sprint
OTE (Original Time Estimate) = total original hours (OTE) of all issues and sub-issues in the Release/Epic/Sprint

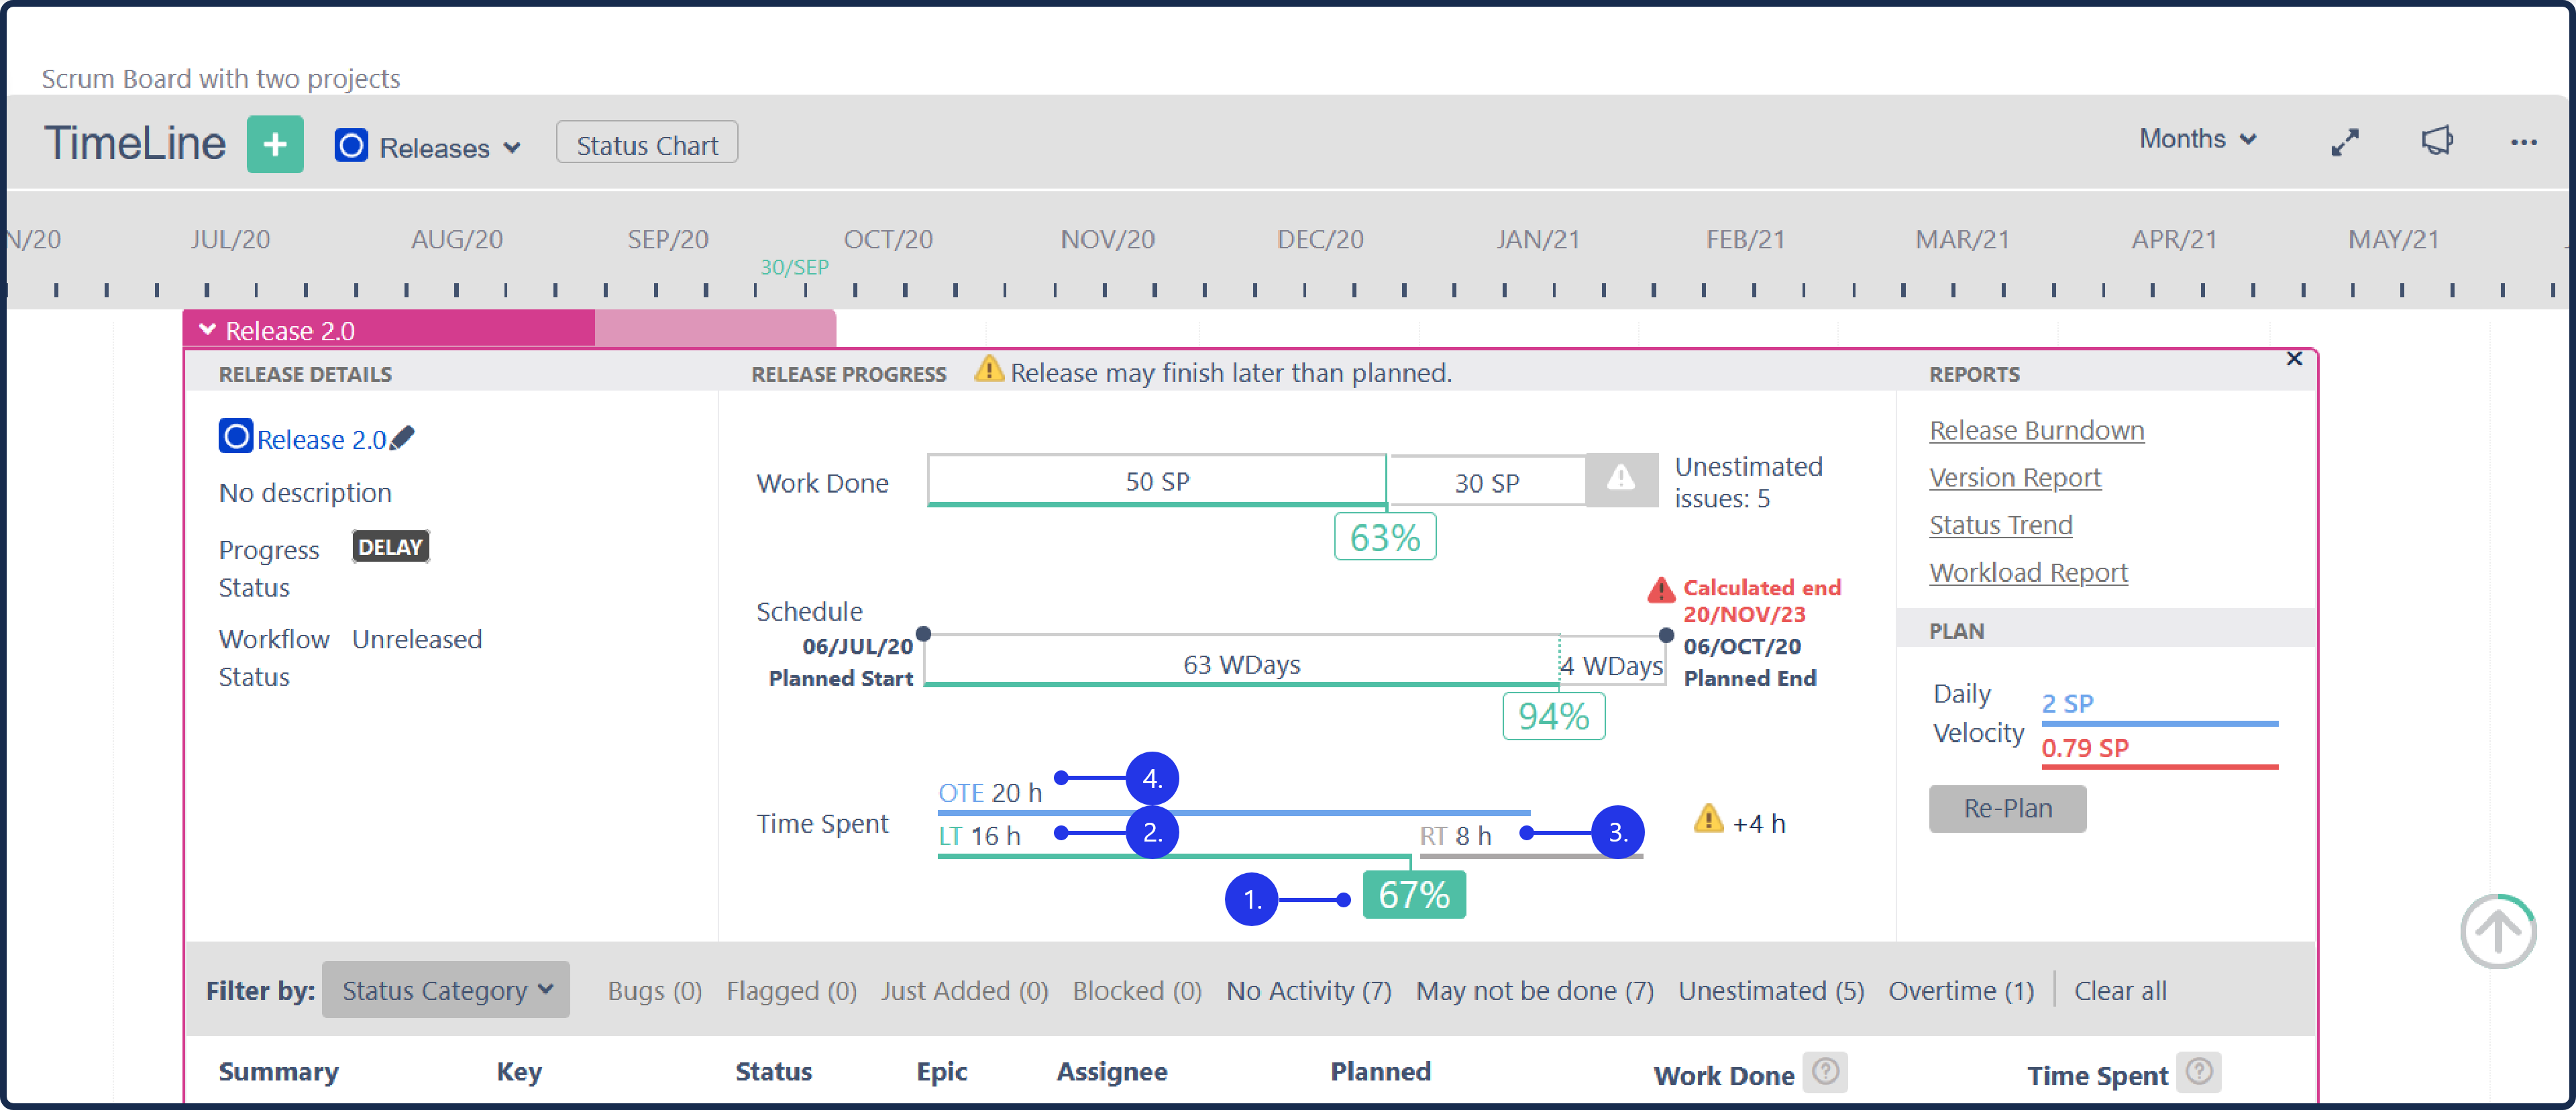
Based on the actual Daily Velocity and already logged hours there are several warnings you might get:
If the logged time will probably be more than the Original Time Estimate, you will get a yellow warning. Hover over it and get details.
If the logged time will definitely be more than the Original Time Estimate, you will get a red warning. Hover over it and get details.
.png?version=1&modificationDate=1601473677497&cacheVersion=1&api=v2&width=673)
.png?version=1&modificationDate=1601473677350&cacheVersion=1&api=v2&width=673)
.png?version=1&modificationDate=1601473677497&cacheVersion=1&api=v2&width=680)
.png?version=1&modificationDate=1601473677350&cacheVersion=1&api=v2&width=680)